Setting up a full Erigon Ethereum node on AWS - Part 4/4 Monitoring with Grafana and Prometheus

This post is part of a multi-series write-up about setting up Erigon on AWS. If you followed the previous posts, you should have a three instances running in your AWS VPC: one for the Ergion full Ethereum node, another one for the SSH bastion and the third for running the metrics. In this final part of our series we will configure Grafana and Prometheus to collect metrics about how Erigon node.
Table of contents
- Terraforming AWS
- Linux Security hardening with Ansible
- Erigon and RPC Daemon
- Metrics and monitoring with Prometheus and Grafana (this guide)
Ansible Playbooks
As usual, we will deploy the metrics server using a set of Ansible roles and collections. First, let's install the first one called grafana_stack from fahcsim:
$ ansible-galaxy collection install fahcsim.grafana_stackFor Prometheus, we will hand craft the Ansible role for installing and configuring the daemon that will collect metrics from the Erigon node. This is the basic structure of our role:
.
├── roles
│   ├── prometheus_server
│   │   ├── handlers
│   │   │   └── main.yml
│   │   ├── tasks
│   │   │   └── main.yml
│   │   ├── templates
│   │   │   ├── prometheus.service.j2
│   │   │   └── prometheus.yml.j2
│   │   └── vars
│ │ └── main.ymlThis should be self explanatory: the handlers folder is an event handler that allows us to trigger some cleanup once we finish setting up prometheus, the templates contain both our systemd startup script, as well as the Prometheus configuration.
Let's start with the main playbook:
---
- name: extract tarball
  ansible.builtin.unarchive:
    src: "https://github.com/prometheus/prometheus/releases/download/v\
         {{  version  }}/prometheus-{{  version  }}.linux-amd64.tar.gz"
    dest: /tmp
    remote_src: true
  tags:
    - prometheus
  changed_when: false

- name: create /opt/prometheus directory
  ansible.builtin.file:
    path: /opt/prometheus
    state: directory
    owner: root
    group: root
    mode: 0755

- name: move prometheus binary
  ansible.builtin.copy:
    src: "/tmp/prometheus-{{  version  }}.linux-amd64/prometheus"
    dest: /opt/prometheus
    owner: root
    group: root
    mode: 0755
    remote_src: true
  tags:
    - prometheus
  notify: cleanup installer directory
  changed_when: false

- name: template systemd unit file
  ansible.builtin.template:
    src: templates/prometheus.service.j2
    dest: /etc/systemd/system/prometheus.service
    owner: root
    group: root
    mode: 0755
  tags:
    - prometheus
  changed_when: false

- name: make directory for prometheus config
  ansible.builtin.file:
    path: "{{  item  }}"
    state: directory
    owner: root
    group: root
    mode: 0644
  with_items:
    - /etc/prometheus
    - /etc/prometheus/rules.d
    - /etc/prometheus/files.d

- name: template prometheus config file
  ansible.builtin.template:
    src: templates/prometheus.yml.j2
    dest: /etc/prometheus/prometheus.yml
    owner: root
    group: root
    mode: 0644
  tags:
    - template
- name: reload systemd daemon
  ansible.builtin.systemd:
    daemon_reload: true
  tags:
    - prometheus

- name: enable and start prometheus service
  ansible.builtin.systemd:
    name: prometheus
    enabled: true
    state: started
  tags:
    - prometheus
The vars only define the version of Prometheus we're installing for now:
---
version: 2.35.0This is our handler where we nuke the temp folder after we're done installing Prometheus:
---
- name: cleanup installer directory
  ansible.builtin.file:
    path: "/tmp/prometheus-{{  version  }}.linux-amd64"
state: absentAnd lastly, our templates
[Unit]
Description=Prometheus
Documentation=https://prometheus.io/docs/introduction/overview/
Wants=network-online.target
After=network-online.target

[Service]
Type=simple
User=root
Group=root
ExecReload=/bin/kill -HUP $MAINPID
ExecStart=/opt/prometheus/prometheus \
  --config.file=/etc/prometheus/prometheus.yml \
  --storage.tsdb.path=/var/lib/prometheus \
  --web.console.templates=/etc/prometheus/consoles \
  --web.console.libraries=/etc/prometheus/console_libraries \
  --web.listen-address=0.0.0.0:9090 \
  --web.external-url=

SyslogIdentifier=prometheus
Restart=always

[Install]
WantedBy=multi-user.targetglobal:
scrape_interval: 10s
scrape_timeout: 3s
evaluation_interval: 5s
scrape_configs:
- job_name: erigon
metrics_path: /debug/metrics/prometheus
scheme: http
static_configs:
- targets:
- 10.0.0.84:6060Note that the target will be different for your setup, make sure to add your private IP of the Erigon box here. Now that we have the full role, we can define our metrics server playbook:
---
- hosts: metrics_node
  become: true
  collections:
    - devsec.hardening
    - fahcsim.grafana_stack
  vars:
    users:
      - name: raz
        # generated using openssl passwd -salt <salt> -1 <plaintext>
        password: '$1$salty$BnuYTcuR3sS3eurvygJ.H1'
        pub_keys:
          - templates/users/raz/key.pub
    sysctl_overwrite:
      # Enable IPv4 traffic forwarding.
      net.ipv4.ip_forward: 1
  roles:
    - users
    - devsec.hardening.os_hardening
    - role: fahcsim.grafana_stack.grafana
      tags: grafana
    - role: prometheus_server
      tags: prometheus
Note that we apply the same hardening roles to our metrics server as well - this is good practice. This server will host our Grafana dashboard directly. A further improvement would be to isolate this instance as well and configure NGINX to serve the HTTP traffic.
ansible-playbook -i production metrics.ymlGrafana
In our previous Terraform steps, we configured an Elastic IP and attached it to the metrics instance. We also configured the necessary Security Groups and routing to allow us to access Grafana publicly. Figure out yoru Elastic IP address for your metrics box and access it in your browser: http://34.xxx.xxx.xxx:3000. You will get a chance to setup your admin account once you load that.
Once you are logged into your Grafana instance, navigate to your Configuration > Data Sources and add the Prometheus collector: we're running the collector on the same box, so the address will simply be http://0.0.0.0:9090
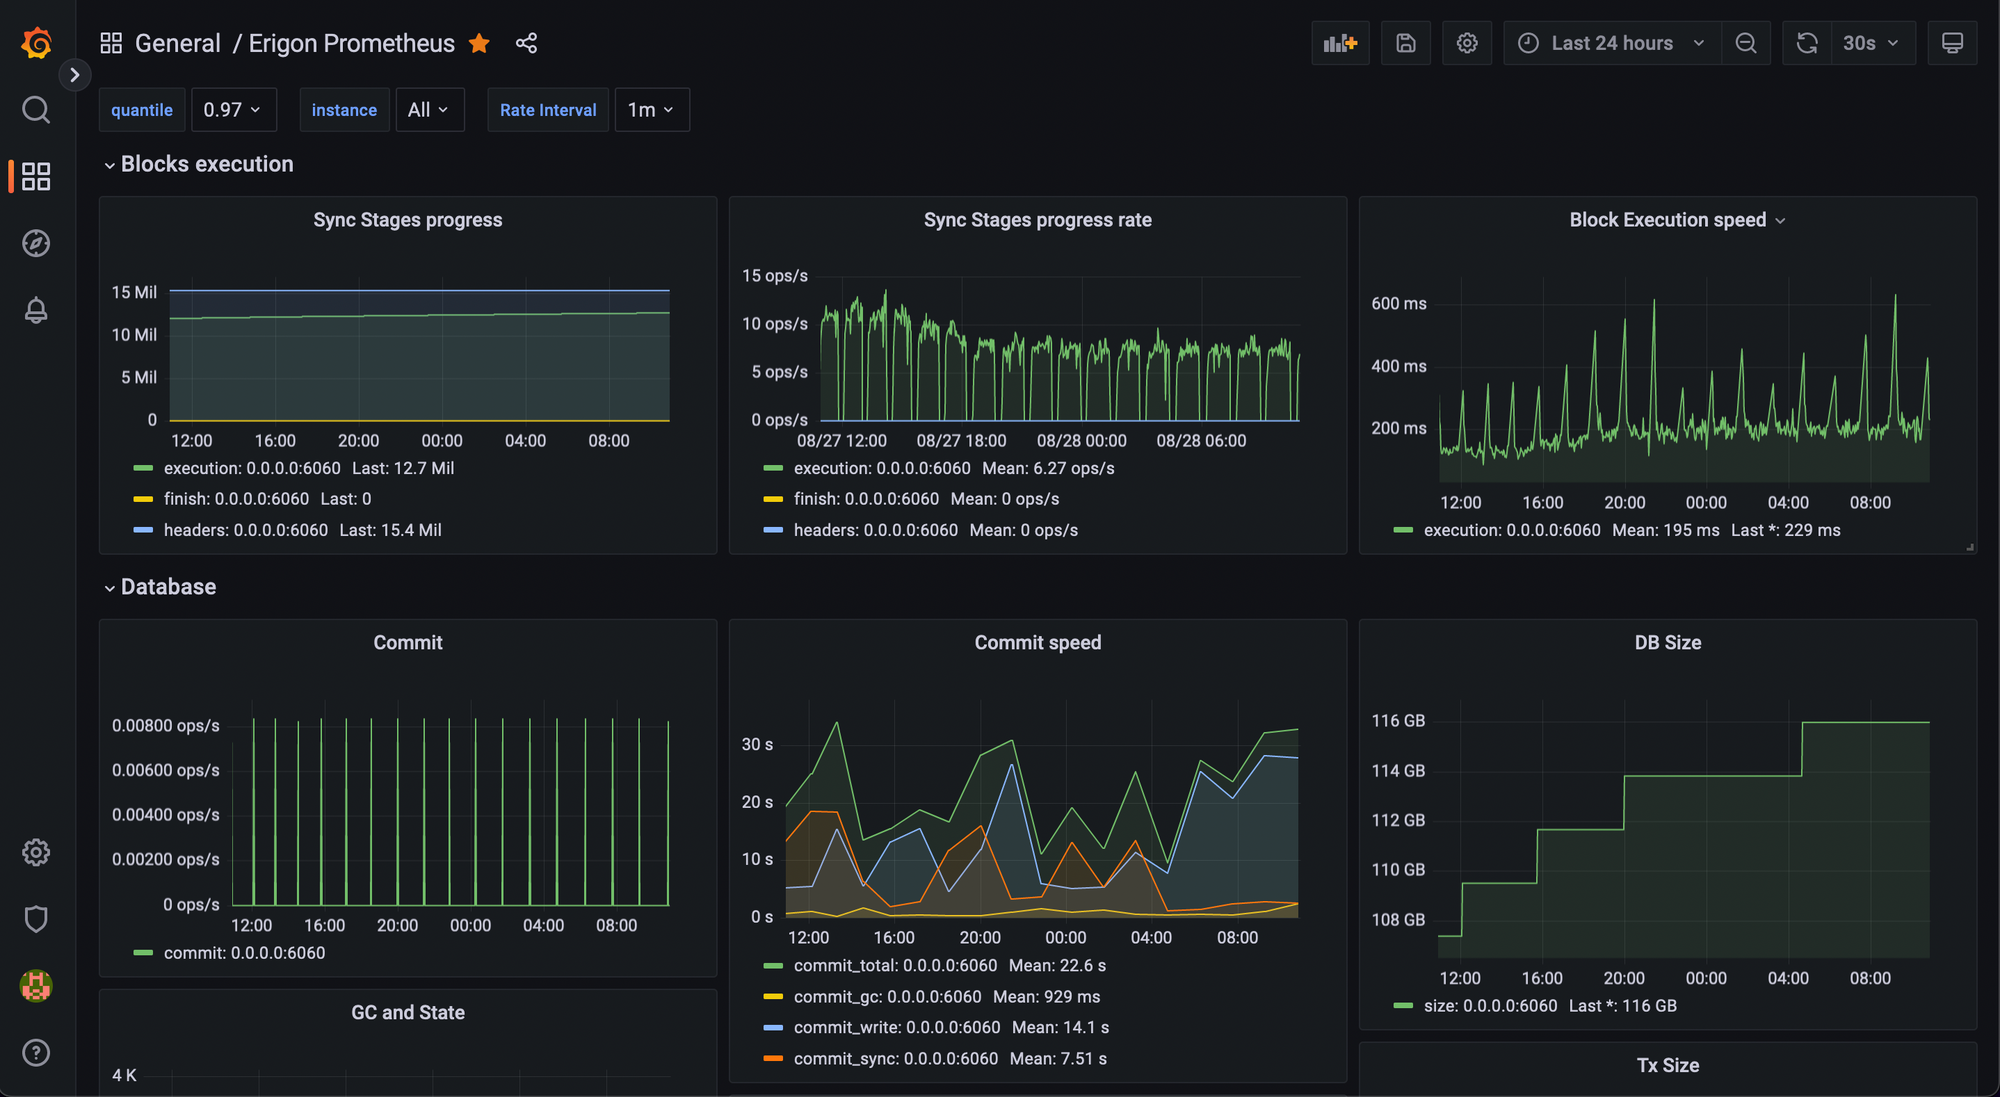
Now you can load the Dashboard. I uploaded the JSON file in a gist for convenience.
Closing Remarks
We covered a lot in our four part series, but there's one more thing to configure to get this node to operate as an Execution Layer for the Ethereum PoS network:
- JWT Authentication between the Erigon node (Execution Layer) and the Beacon Chain (Consensus Layer)
Erigon automatically generates a JWT secret and stores it in the default data folder: ~/mainnet/jwt.hex. All we need to do for Erigon is to pass an argument to pick this up:
[Unit]
Description=Erigon Node
After=network.target network-online.target
Wants=network-online.target

[Service]
WorkingDirectory=/usr/local/bin
ExecStart=/usr/local/bin/erigon --datadir=/var/data/mainnet --private.api.addr=0.0.0.0:8090 --prune=hrtc --prune.h.older=90000 --prune.r.older=90000 --prune.t.older=90000 --prune.c.older=90000 --metrics --metrics.addr 0.0.0.0 --authrpc.addr 0.0.0.0 --authrpc.vhosts <CL host> --authrpc.jwtsecret
User=erigon
Restart=always
RestartSec=5s

[Install]
WantedBy=multi-user.targetIf you can't spot the difference, this is where we added --authrpc.addr 0.0.0.0 --authrpc.vhosts <CL_HOST> --authrpc.jwtsecret.
How long will Erigon take to sync
This depends on your hardware, specially how fast your SSD is. I was able to sync a node on AWS using the exact instance types I specified here in about 10 days. This is a lot! But if you use your own hardware, you can lower that to a couple of days.
How much disk space do I need?
We configured 1TB for the Erigon node because we knew we will use pruning (getting rid of old state we no longer need). The Execution Layer does need transaction receipts and we configured Erigon to keep them starting from the right block number. Your synced node at the time of this writing should be around 500GB
Member discussion